"How do we uncover patterns, routines, and actions that have become invisible to us?"
#100Daysofdata is a project a friend and I’ve been doing where each day, we pick a prompt, track it throughout the day, and produce an analog ‘data visualization’ on a post-it at the end of the day. So far, we’ve tracked things like “How many ads did I see today?” and “How many times did I say “Hello” today?” We’ve also been documenting these (along with snippets of reflections) on Instagram, under #100DaysOfData.
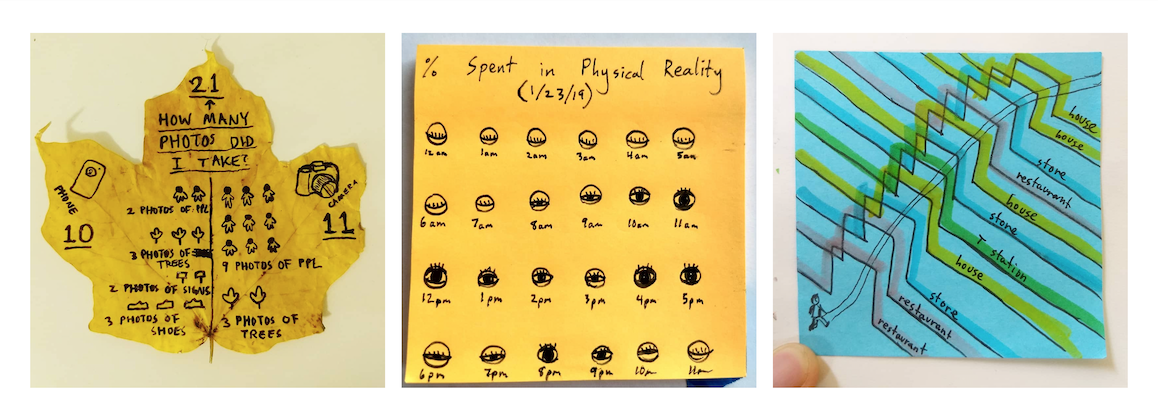
Some personally collected data visualizations.
This project started as a way to think about our relationship to data in our everyday lives. In a world where we are defined by small patterns (largely by giant tech companies), we wanted to engage with the idea of “big data” by asking our own questions, collecting our own information about ourselves (without relying on technology), and finding out what that means for us. Through this (mostly) analog process, we reflect on ways that our identities (as well as technologies) mediate our interactions with the world, and reflect on data's potential, as well as limitations, to uncover them.
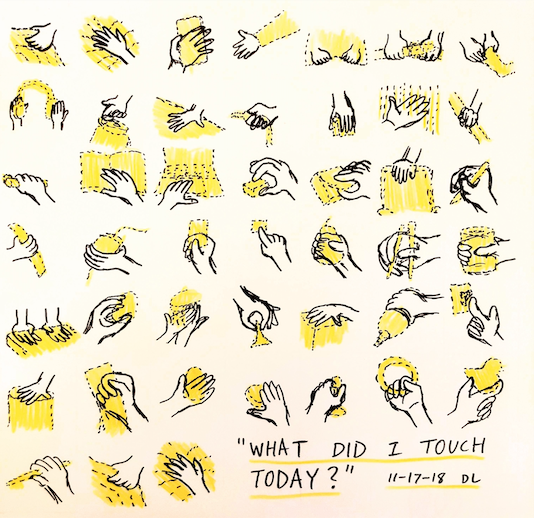
One of my favorite visualizations - "What did I touch today?"
We had the wonderful opportunity to showcase our project at the Berkman Klein Center's mini-gallery exhibit from December 2018 - February 2019. The responses we got from it was amazing!
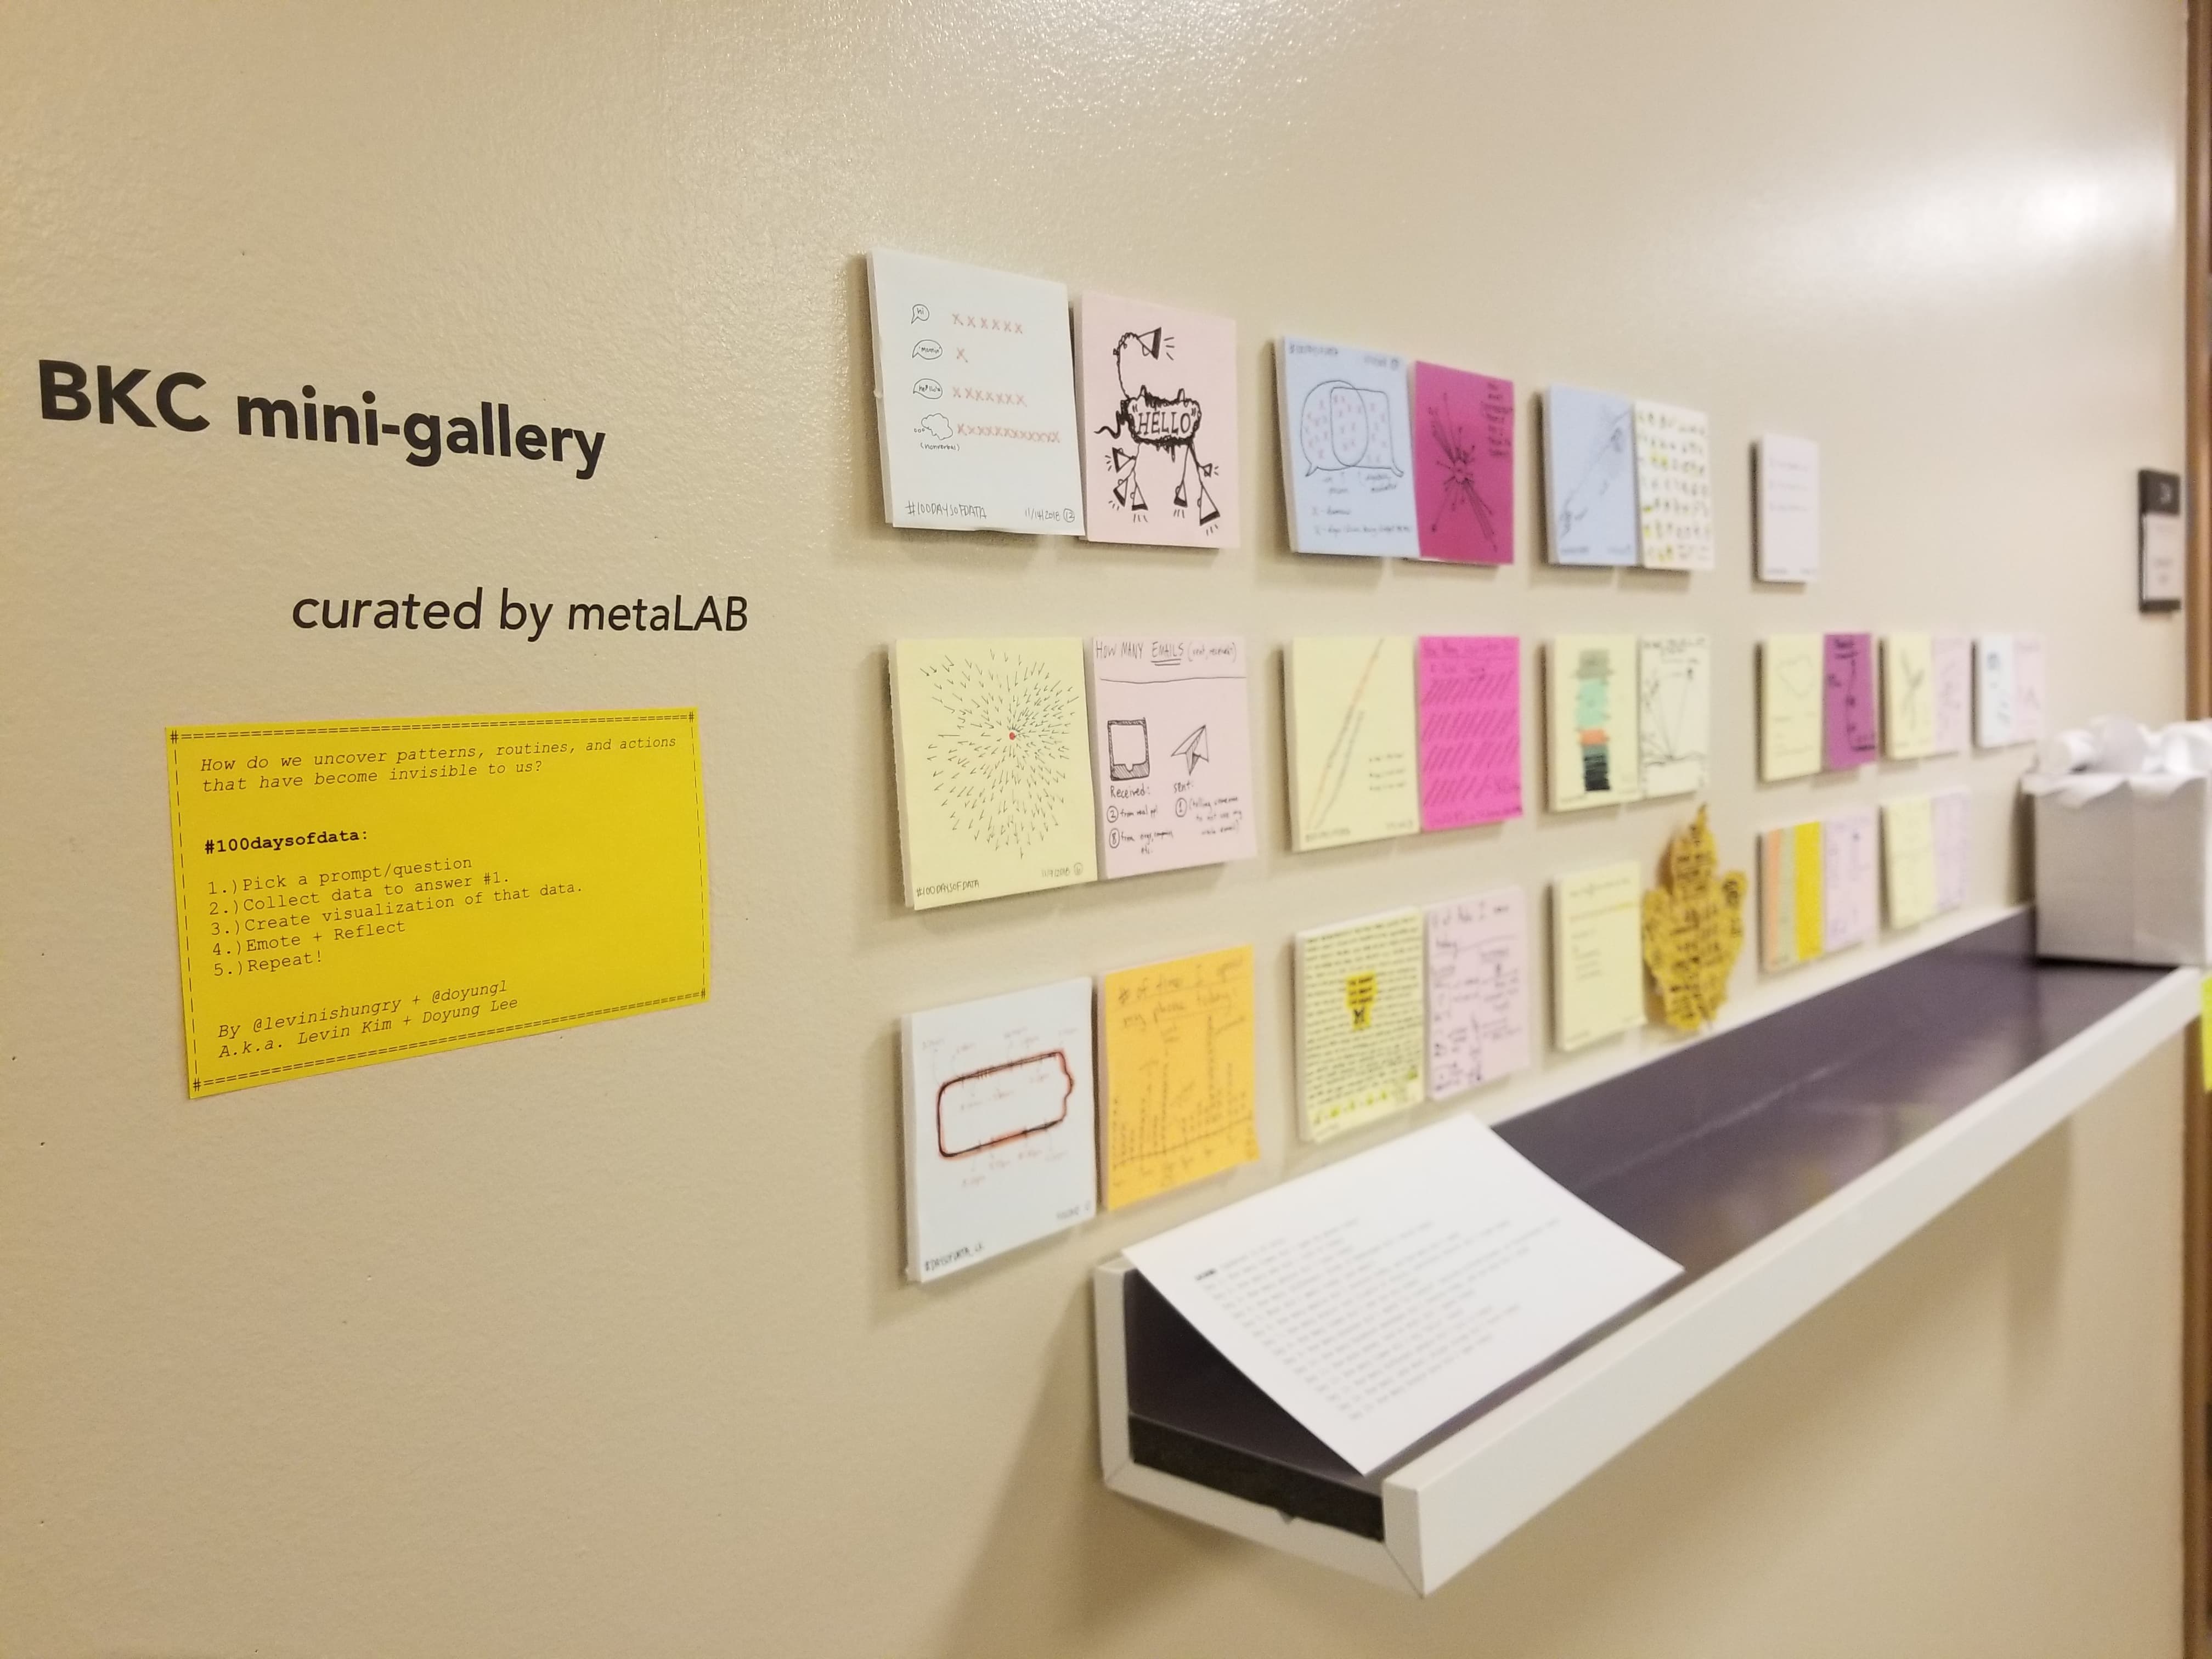
Photo credit: Levin K
Currently, we are thinking about including an audio component to this project. We found that some of the richest insights came from when my friend and I were reflecting on our visualizations together, and wanted a way to capture it. Our project was a semi-finalist on Google's Podcast Creator program, and we are continuing to experiment with including audio to our project.